

Overview
In the previous post of the series, we covered how to implement the different observability features that are available in Logic Apps Standard to send traces to Application Insights. In this post, we’ll discuss how to query and analyse these traces, and how to share these queries and publish query results. The series is structured as outlined below:
- Introduction – describes the built-in observability features available in Logic Apps Standard.
- Reference implementation – shows how these features can be leveraged and implemented.
- Querying and analysing Logic Apps traces (this article) – shows how to query and analyse Logic Apps application traces, and how to publish and share queries and charts.
Creating Queries
As mentioned previously, Logic Apps Standard sends telemetry and diagnostic traces to Application Insights. Diagnostic traces can be queried and analysed using Kusto Query Language (KQL). In this section, I’ll share some queries that can be used to troubleshoot and analyse Logic Apps run history.
As described in the previous post, some tracing properties that we’ll be getting through the query results are produced by the workflows by default and others are to be configured during the build phase. For instance, custom tracking id, tracked properties, custom error code, and custom error message are properties that must be configured while creating the workflow.
Logic App Instances
The query below returns Logic App instance details, including workflow run identifier, client tracking id, and workflow status. I've also included commented out query filters that can be leveraged to filter trace records. For instance, you can filter trace records using the Logic App name, workflow name, custom tracking id, or workflow status. I've included similar filters in most of the queries in this section.
// Logic App instances with workflow run id, client tracking id, and workflow final status.
// If required, uncomment filters at the bottom and add filter values.
traces
| where operation_Name == "FlowRunLastJob"
| extend resource = parse_json(tostring(parse_json(tostring(customDimensions.prop__properties)).resource))
| project timestamp
   , LogicApp = tostring(cloud_RoleName)
   , Workflow = tostring(resource.workflowName)
   , WorkflowRunId = tostring(customDimensions.prop__flowRunSequenceId)
   , ClientTrackingId = tostring(customDimensions.prop__clientTrackingId)
   , WorkflowStatus = customDimensions.prop__status
| sort by timestamp desc
//| where LogicApp contains ""
//| where Workflow contains ""
//| where ClientTrackingId contains ""
//| where WorkflowStatus == "Succeeded"
//| where WorkflowStatus == "Failed"
//| where WorkflowStatus == "Cancelled"
Code snippet 1 Querying Logic App workflow instances
A sample result of this query is depicted below.
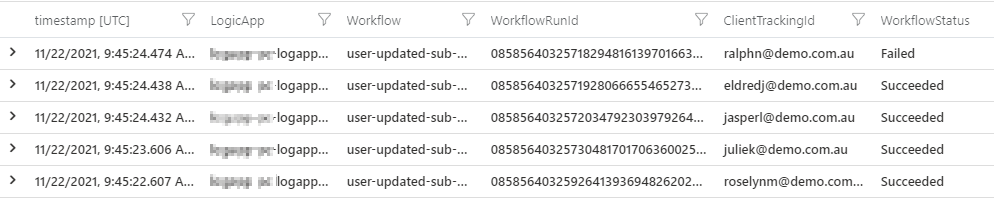
Figure 1. Logic App workflow instances query result
Logic App Instances with Tracked Properties
The query below includes tracked properties. In the Logic App workflows that I showed in the previous post, I’m adding an interface identifier as a tracked property. This query shows how to retrieve that value.
Given that tracked properties are stored in a different trace record, we need to join two different traces using the workflow run identifier as shown below. In this query, I've added a commented out filter for a tracked property, which in this case is the interface identifier.
// Logic App instances with workflow final status, workflow run id, client tracking id, and tracked properties.
// If required, uncomment filters at the bottom and add filter values.
traces
| where operation_Name == "FlowRunLastJob"
| extend resource = parse_json(tostring(parse_json(tostring(customDimensions.prop__properties)).resource))
| project timestamp
   , LogicApp = tostring(cloud_RoleName)
   , Workflow = tostring(resource.workflowName)
   , WorkflowRunId = tostring(customDimensions.prop__flowRunSequenceId)
   , ClientTrackingId = tostring(customDimensions.prop__clientTrackingId)
   , WorkflowStatus = customDimensions.prop__status
| join kind = leftouter ( // trackedProperties
   traces
   | where customDimensions.prop__properties has "trackedProperties"
   | extend trackedProperties = parse_json(tostring(parse_json(tostring(customDimensions.prop__properties)).trackedProperties))
   | project InterfaceId = trackedProperties.InterfaceId
       , WorkflowRunId = tostring(customDimensions.prop__flowRunSequenceId)
   | where isnotnull(InterfaceId)
   )
   on $left.WorkflowRunId == $right.WorkflowRunId
| project timestamp
   , LogicApp
   , Workflow
   , WorkflowRunId
   , ClientTrackingId
   , InterfaceId
   , WorkflowStatus
| sort by timestamp desc
//| where LogicApp contains ""
//| where Workflow contains ""
//| where ClientTrackingId contains ""
//| where InterfaceId contains ""
//| where WorkflowStatus == "Succeeded"
//| where WorkflowStatus == "Failed"
//| where WorkflowStatus == "Cancelled"
Code snippet 2. Querying tracked properties
The figure below shows a sample result of the query.
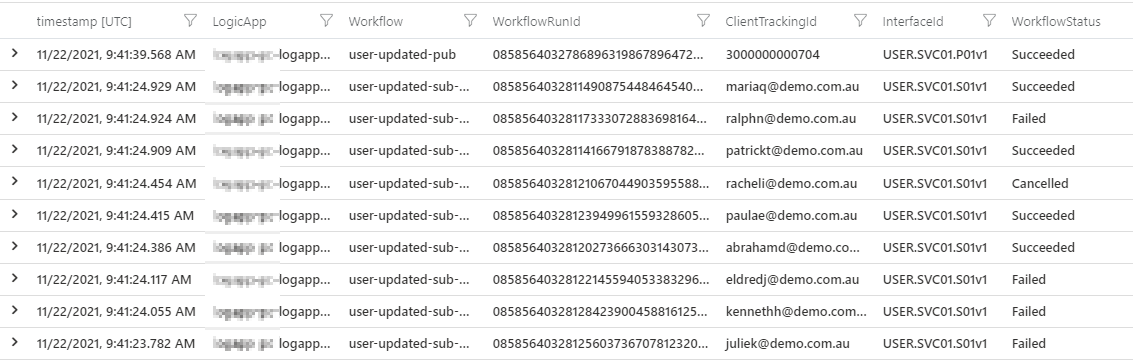
Figure 2. Sample query result including tracked properties
Failed Workflow Instances with Error Details
In the workflows that I described in the previous post, as part of the reference implementation, I used error handling with terminate action that throws custom error codes and error messages.
The following query shows all the workflow instances that have failed including their error codes and error messages. Error codes and messages can be built-in or custom values defined in a terminate action.
// Failed Logic App instances with workflow final status, workflow run id, client tracking id, and error details.
// If required, uncomment filters at the bottom and add filter values.
traces
| where operation_Name == "FlowRunLastJob"
| extend resource = parse_json(tostring(parse_json(tostring(customDimensions.prop__properties)).resource))
| extend error = parse_json(tostring(customDimensions.prop__error))
| project timestamp
   , LogicApp = tostring(cloud_RoleName)
   , Workflow = tostring(resource.workflowName)
   , WorkflowRunId = tostring(customDimensions.prop__flowRunSequenceId)
   , ClientTrackingId = tostring(customDimensions.prop__clientTrackingId)
   , WorkflowStatus = customDimensions.prop__status
   , ErrorCode = error.code
   , ErrorMessage = error.message
| join kind = leftouter ( // trackedProperties
   traces
   | where customDimensions.prop__properties has "trackedProperties"
   | extend trackedProperties = parse_json(tostring(parse_json(tostring(customDimensions.prop__properties)).trackedProperties))
   | project InterfaceId = trackedProperties.InterfaceId
       , WorkflowRunId = tostring(customDimensions.prop__flowRunSequenceId)
   | where isnotnull(InterfaceId)
   )
   on $left.WorkflowRunId == $right.WorkflowRunId
| project timestamp
   , LogicApp
   , Workflow
   , InterfaceId
   , WorkflowRunId
   , ClientTrackingId
   , WorkflowStatus
   , ErrorCode
   , ErrorMessage
| sort by timestamp desc
| where WorkflowStatus == "Failed"
//| where InterfaceId contains ""
//| where ClientTrackingId contains ""
//| where LogicApp contains ""
//| where Workflow contains ""
Code snippet 3. Querying failed workflow instances
Below, you can see a sample result of said query.
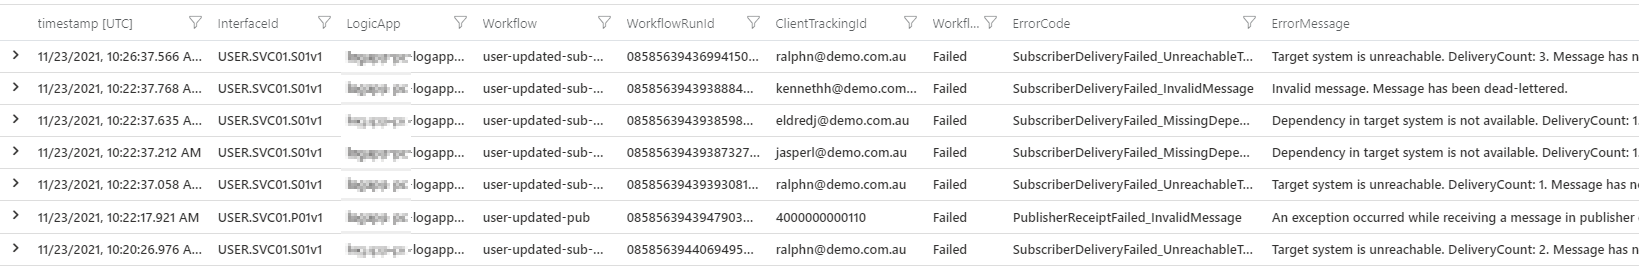
Figure 3. Sample query result of failed workflow instances including error code and error message
Troubleshooting a Logic App run instance
After identifying a failed instance and noting its run instance identifier, the execution details of the workflow can be seen. For that, go to the workflow run history and search by the run identifier. If the workflow is stateful, inputs and outputs of the workflow run can also be seen, as shown in the clip below. I find this functionality very useful for troubleshooting.
Figure 4. Opening up a workflow instance by its run identifier
Failed Instances Count per Workflow
The query below returns the count of failed instances per workflow summarised by day.
traces
| where operation_Name == "FlowRunLastJob"
| extend resource = parse_json(tostring(parse_json(tostring(customDimensions.prop__properties)).resource))
| project timestamp
   , LogicApp = tostring(cloud_RoleName)
   , Workflow = tostring(resource.workflowName)
   , WorkflowStatus = tostring(customDimensions.prop__status)
| where WorkflowStatus == "Failed"
| summarize Count = count()
   by bin(timestamp, 1d)
   , Workflow
Code snippet 4. Querying count of failed instances grouped per workflow
The figure below depicts a sample stacked bar chart.
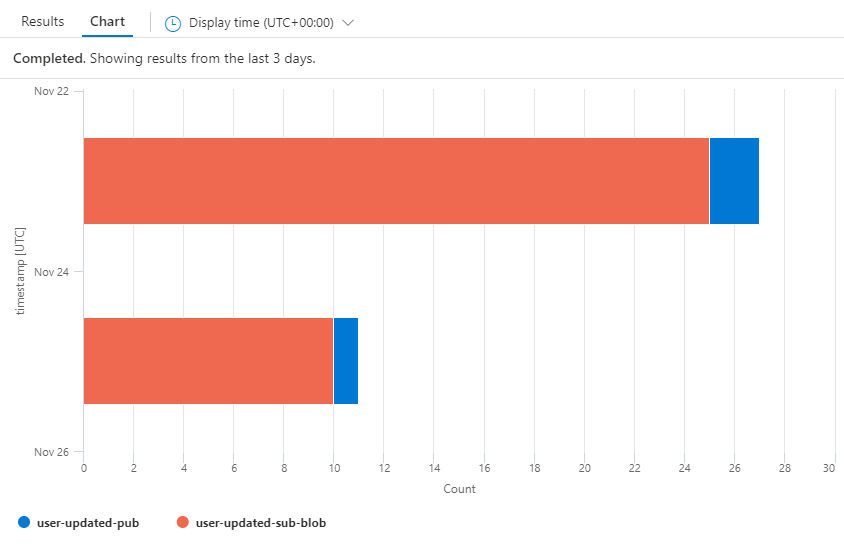
Figure 5. Stacked bar chart of count of failed instances grouped per workflow
Failed Trigger Details
The query below returns the details of failed triggers.
// Failed Logic App triggers.
// If required, uncomment filters at the bottom and add filter values.
traces
| where customDimensions.EventName == "WorkflowTriggerEnd"
| where customDimensions.prop__status == "Failed"
| sort by timestamp desc
| extend properties = parse_json(tostring(customDimensions.prop__properties))
| extend resource = parse_json(tostring(parse_json(tostring(customDimensions.prop__properties)).resource))
| extend error = parse_json(tostring(customDimensions.prop__error))
| sort by timestamp desc
| project timestamp
   , LogicApp = tostring(cloud_RoleName)
   , Workflow = tostring(resource.workflowName)
   , WorkflowRunId = tostring(customDimensions.prop__clientTrackingId)
   , TriggerStatusCode = properties.code
   , ErrorCode = tostring(error.code)
   , ErrorMessage = tostring(error.message)
   , message
//| where LogicApp contains ""
//| where Workflow contains ""
//| where TriggerStatusCode == ""
//| where ErrorCode == ""
//| where ErrorMessage contains ""
//| where Message contains ""
Code snippet 5. Querying failed triggers
A sample result is depicted below.

Figure 6. Sample query result of failed triggers
Failed Trigger Count Per Workflow
The query below returns the trigger count per workflow summarised per day.
traces
| where customDimensions.EventName == "WorkflowTriggerEnd"
| where customDimensions.prop__status == "Failed"
| extend resource = parse_json(tostring(parse_json(tostring(customDimensions.prop__properties)).resource))
| project timestamp
   , LogicApp = tostring(cloud_RoleName)
   , Workflow = tostring(resource.workflowName)
| summarize Count = count()
   by bin(timestamp, 1d),
   Workflow
| render barchart
| sort by timestamp desc
Code snippet 6. Querying count of failed triggers grouped per workflow
This result set can be rendered as a stacked bar chart.
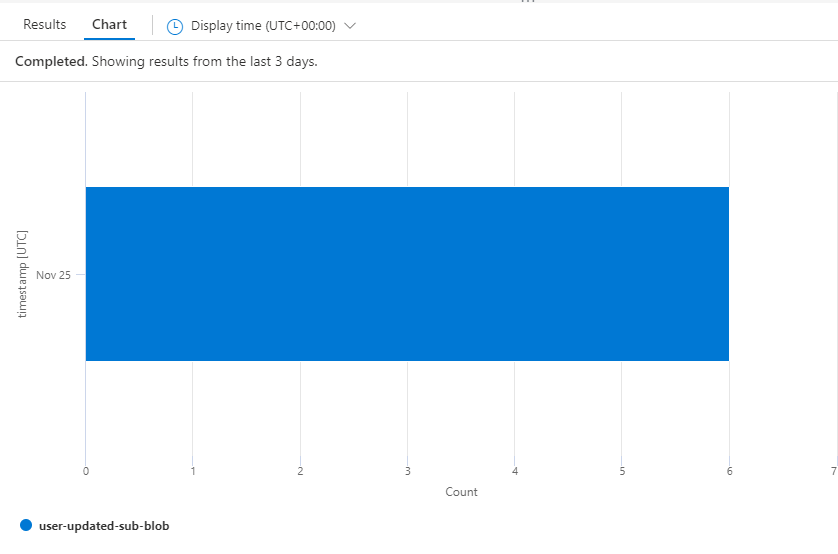
Figure 7. Stacked bar chart of count of failed triggers grouped per workflow
Saving and Sharing Queries
If there is a need to save KQL queries and share them with the team, the best way to do it is using Azure Monitor query packs. Query packs are a container for log queries that can be collaboratively created, updated, and shared across multiple users and workspaces. Query packs provide role-based access control with reader and contributor roles.
Publishing Queries and Charts to an Azure Dashboard
You can publish Application Insights query results and charts to an Azure dashboard. The official documentation describes how to create a dashboard, how to pin log query results and charts to a dashboard, and how to share a dashboard.
The picture below depicts a dashboard that contains some of the queries and charts that I described above.
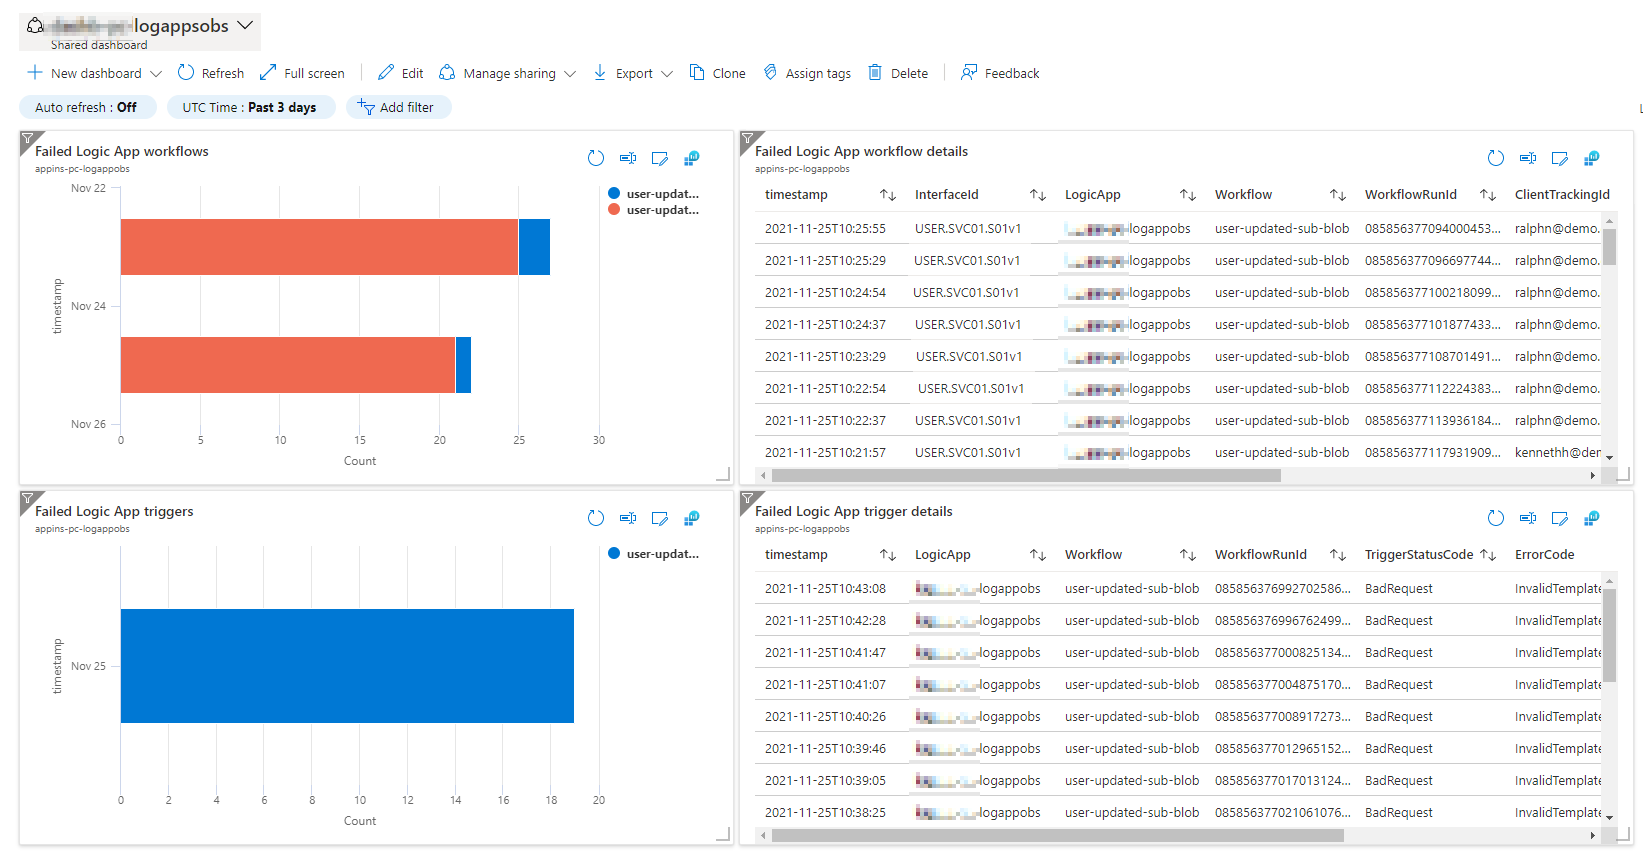
Figure 8. Sample Azure dashboard with widgets created from Application Insights queries and charts
Querying across multiple Application Insight Instances via Log Analytics Workspaces
All the previous queries target traces sent to Application Insights. It is a common practice to create an Application Insights instance per Logic App. If queries are needed across multiple Logic Apps, the corresponding Application Insights can be configured to be workspace-based, which means that all the traces are ingested in a common Log Analytics workspace. This way queries that span across multiple Logic Apps can be run. When querying application traces in Log Analytics, the table name and some column names are different. The query below shows how to query Logic App traces using Log Analytics tables.
AppTraces
| where OperationName == "FlowRunLastJob"
| extend resource = parse_json(tostring(parse_json(tostring(Properties.prop__properties)).resource))
| project TimeGenerated
   , LogicApp = tostring(AppRoleName)
   , Workflow = tostring(resource.workflowName)
   , WorkflowRunId = tostring(resource.runId)
   , ClientTrackingId = tostring(Properties.prop__clientTrackingId)
   , WorkflowStatus = tostring(Properties.prop__status)
| sort by TimeGenerated desc
Code snippet 7. Querying Logic App traces in Log Analytics
Feedback to the Product Group
In this series, we’ve seen how to implement some solution-level observability practices in Logic Apps Standard. Application Insights integration with Logic Apps is very useful. However, I believe there is still room for improvement. Below, I provide feedback for the product group to consider:
- Show custom tracking identifier in the run history view for Logic Apps Standard. Currently, in the run history section of a Logic App workflow, we cannot see the client tracking id. It’d be very beneficial to show this value directly in the run history blade for troubleshooting purposes. If you think this is a good idea, please upvote it here.
- Add filtering capabilities in the run history view for Logic Apps Standard. Currently, the Logic Apps Standard run history provides basic sorting capabilities. However, it’d be very useful to be able to filter by date range, status, and client tracking id. If you think this is a good idea, please upvote it here.
- Always flush tracked properties in Logic Apps Standard before a workflow finishes or is terminated. I’ve frequently seen that tracked properties are not always sent to Application Insights. Based on my experience, this can be mitigated if there is a delay action that prevents a workflow from finishing very soon after an action with tracked properties. However, I’d expect that tracked properties are reliably sent to Application Insights. If you think this is important, please upvote it here.
Wrapping Up
In the last post of the series, I’ve shown how to query application traces to help troubleshoot and analyse Logic Apps. I’ve also covered how to save and share queries, and how to publish and share result sets and charts. Finally, I shared how we can run queries across multiple Application Insights that are linked to the same Log Analytics workspace. I hope you’ve enjoyed and learned something useful from this blog series.
Happy monitoring!
Cross-posted on Paco's blog
Follow Paco on @pacodelacruz